
Create solid data foundations
Whether it’s financial data, sales & marketing data or something more niche, storing, editing and using your data to predict future metrics can make the difference between you and your competitors.
Think about the different types of data you collect. How do you store, optimise and use it? In this post we’ll explore what you can do to turn your business information into a cash cow.
1. Understanding Your Data
It’s generally accepted that there are two different forms of data, structured and unstructured.
Structured Data – This follows an organised layout. It is typically stored in a relational database (eg SQL) and it’s easily searchable. Examples of this could be product orders, customer names and employment status.
Unstructured Data – On the other hand this is raw data and has little to no organisation behind it. The storage methods can vary greatly, ranging from NoSQL databases to JPEGs and PDFs. Therefore, to search unstructured data you’ll require more complicated tools compared with structured data. Imagine searching through 10,000s of images for a certain colour, not easily doable! Typical types of this form of data include images, social media posts and emails.
Whilst reading this… you might think that structured data would be far more useful as it’s much easier to query. Bear in mind, unstructured data can give you important insights into solving problems. Take a doctor treating a patient. Whilst written records (name, DOB, medical history etc.) can be important, unstructured data (X-rays, MRIs etc.) can be even more useful. Just more difficult to interpret. It’s likely that you’ll need both to solve your problem.
2. Storing Your Data
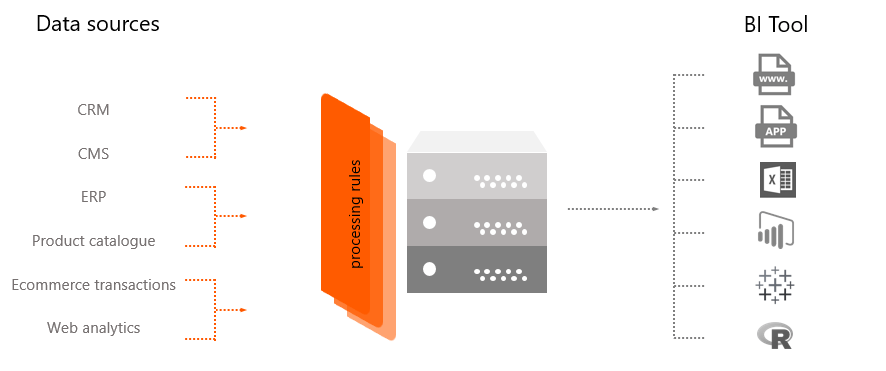
Once you’ve identified what types of data you collect and what is important, how should you access and store all this data? We think this is best done in a data warehouse. Whilst storing the data in additional storage may seem unnecessary at first, there are many benefits to a data warehouse…
Single Version Of The Truth – All users will get the same results for a single question. Data warehousing eliminates the issue of different stakeholders applying different business rules when processing the data.
Simplicity – Data warehousing enables self service. It delivers insights to the report users in their preferred environment. And as the data within the warehouse has already been cleaned and processed this reduces the time for conducting repetitive data tidying tasks.
Performance – Exporting data into a warehouse reduced the load on the production systems. As reporting often requires expensive memory operations, it’s crucial to ensure those do not affect the availability of any live systems’ collection of data.
Retaining Historical Data – Often, production systems of record are not designed to store the historical state of a variable, but instead overwrite values. A data warehouse can address this issue by recording data snapshots and using that for reporting changes that occur over time.
All in all, we believe a data warehouse is not another tool in your toolbox, but instead a foundation for creating a data-driven culture within your organisation.
3. Using Your Data
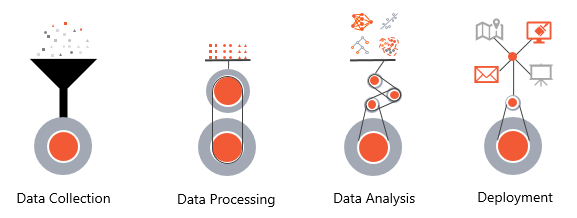
If you want to use your data to illuminate a strategic pathway and to back decisions, you’ll need to apply data analytics. This can be simply split into four stages to make it much more manageable.
Data Collection – collect your data and ask a question of it.
Data Processing – clean and iterate your data.
Data Analysis – analyse and model your data.
Deployment – release your results and use the insights gained to feedback into your database and answer your original question.
Starting Your Data Analytics journey
There are many different questions that you can ask of your data. The simplest starting point is to look at what has already happened in the past – with descriptive analytics. Which includes data mining, identifying patterns and trends in your data and creating data visualisations. As a result, descriptive analytics can often highlight areas of opportunity or issues to address for example, leads, sales and conversion trends over time.
The next step up is diagnostic analytics, looking at why something has happened, which includes statistical methods such as correlations and regression analysis. Diagnostic analytics is often beneficial to do before a full predictive model so you can identify what data is important. Diagnostic analytics speaks for itself. It provides the reasons why trends have occurred. By considering variables such as economic, political, seasonal etc. A very simple analysis may be weather related such as a cool summer has impacted ice cream sales.
Predictive analytics is the next level, predicting what will happen in the future. Use of artificial intelligence and machine learning can be used to learn from historical data to predict future outcomes. An example of this could be to predict which leads are likely to interact with certain content and campaigns.
Finally, we have prescriptive analytics, which tells you what you should do to get optimal results. Prescriptive analytics is all about modelling which option will have the best solution, given set parameters. Utilising prescriptive and predictive analytics will be the differentiator between you and your nearest competitors. An example of this could be traffic is likely to increase in London by 25% in the next 5 years. To reduce this load, you could build new roads, introduce tolls and shut off roads etc.
Using Analytics – Use Case
Here we have Jessie, a 24 year old female who is a first time house buyer. We can use her and her actions through a lead scoring model, where certain actions lead to ‘points’. Here you keep an accumulative score for the contact, and use analytics to predict whether the prospect will progress further.
01/01/20 – Acquire contact details
01/01/20 – Contact’s age = 24 (+2 points)
05/01/20 – Opens an email (+3 points)
07/03/20 – Opens an email (+3 points)
03/04/20 – Goes onto website and uses the mortgage calculator (+7 points)
02/05/20 – Opens an email (+3 points)
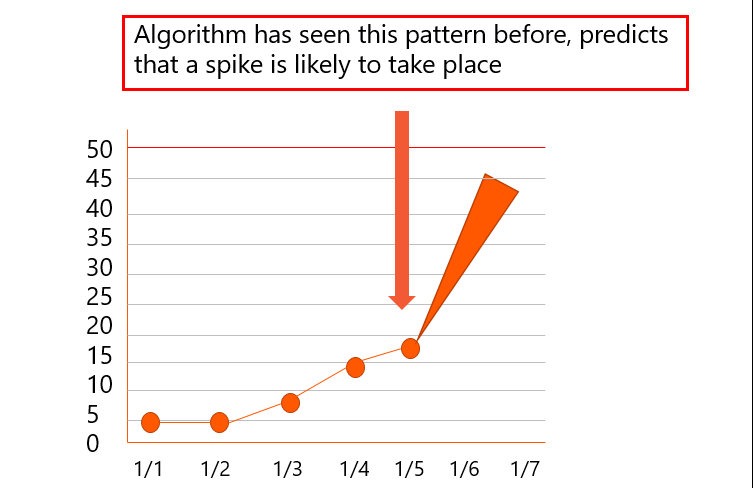
It’s at this point where if we look at the image above, we can see the algorithm predicting that this user will likely achieve a high lead score, basing this user’s actions off of historical data. With the further actions below, we can see that this prediction was correct, with the prospect turning into a lead, contacting the businesses in the coming months.
03/06/20 – Calls an advisor (+5 points)
07/06/20 – Clicks on an email (+5 points)
15/06/20 – Goes onto website and uses the mortgage calculator (+10 points)
17/06/20 – Opens an email (+2 points)
02/07/20 – Clicks on an email (+5 points)
02/07/20 – Calls an advisor (+5 points)
Finally, there’s no point in starting to look at your data unless you have a single, clear view of it. If your data is in 74 excel files, 48 PDFs and 2 google analytics accounts then good luck!