This blog was written by Lawrence Green, a data scientist at Objective IT. If you’d like to get in touch with him or any of the data scientists at Objective IT please fill in our contact us form or send an email to [email protected]!
In this blog I’m going to take a look at probably the two most popular business intelligence platforms, Microsoft’s Power BI and Salesforce’s Tableau. Whilst I could write a novel on comparing and contrasting the two, I will aim to cover the main components and a few more complex features. Having worked with both platforms (Power BI for around two months, Tableau for over a year where I was using the highest complexity (Jedi) guide), I’d like to think I have a strong grasp of what each platform can achieve. With this in mind, I’ll try and compare the two as objectively as possible, so let’s get started…
Let’s start with the question that your boss will always kick off with… what’s it going to cost? Tableau comes in at a pretty hefty $70/user/month. Compare that with the pro version of Power BI which comes in at a much more reasonable cost of $9.99/user/month. When you compare the two at face value here Power BI is the clear winner: is Tableau going to bring in a 7x greater advantage than Power BI… unlikely. From my experience, Tableau is more suited to enterprises, whereas Power BI is greater suited to SMEs and one-man bands. It’s also worth noting that Power BI desktop is free, which makes it highly accessible to anyone.
In terms of functionality, both platforms have intuitive functions of dragging and dropping fields into tables and visualisations. One benefit Tableau has over Power BI is that it’s slightly more precise in that it shown both columns and rows; however, Power BI serves the same purpose with the values field. Both include the functionality of size, tooltips and other visualisation specific fields. Both softwares provide maps visualisations, but there is a higher degree of flexibility in Tableau. One thing Power BI does have is a wide range of user created dashboard objects than you can manually download and import.
Let’s talk code. Both codes used in calculated fields offer similar to Excel – level of detail. They can be fairly easily filtered and you can create quite powerful dimensions or fields. If you’re used to using Excel you’d likely pick up Power BI quickly, as they both use the DAX formula language; therefore there will be less of a learning curve between the two.
One of the more complex features that is available on both Tableau and Power BI was the ability to transform dashboard objects with a dynamic variable. Whilst this is intuitive on Tableau, in Power BI this can be done by creating a bookmark, adding a button that hides itself and the graph, and then show an alternate button and graph, so you can switch between the two (or more).
The last thing to say, as previously mentioned, is that Power BI is owned by and developed by Microsoft, whereas Tableau was originally developed as an independent product, recently acquired by Salesforce. With both products being owned by Enterprise companies, you know that whichever product you decide to use, you know you’ll be in safe hands with support.
All in all, here’s who takes it in my opinion…
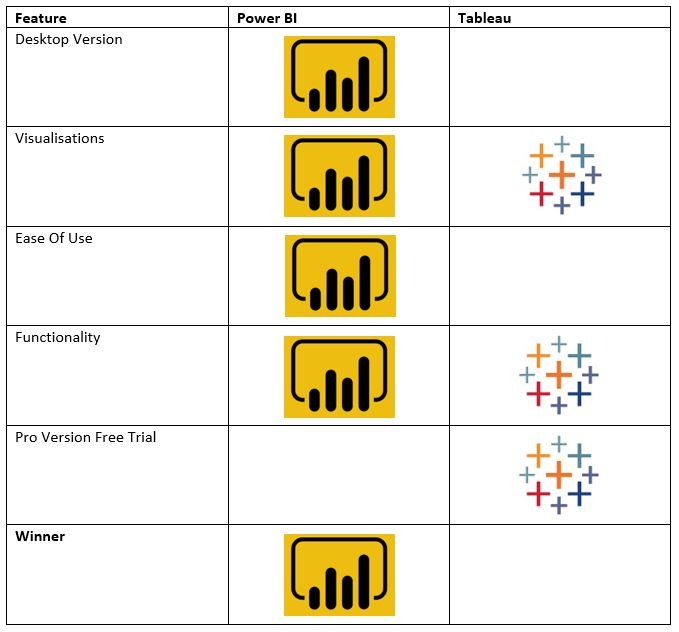
As you can see, I think Microsoft’s BI platform just about pips Tableau to the post. If you’d like to know any more about what we can do with Business Intelligence solutions then get in contact with our team.